How to troubleshoot 4G router connectivity problems and not to deploy full monitoring suite? Similar questions or simple. My 4G router (Advantech) behaves strange, how to find out, what is going on?
Not want to use or go via the hassle of setting up SNMP monitoring or similar. What about getting notification into a Slack channel, when some router metrics changes. This can provide quick and easy insight into what is actually happening and we can use software tools, which are ready available.
We will end up with something like this in your Slack channel:

Let’s start with Slack.
Follow this great documentation from Slack itself how to enable web hooks. Quick tip, create a new channel in your selected workspace to keep it organised.
https://api.slack.com/messaging/webhooks
When you get it, you should end up with a URL to send the messages.
Test the basic curl message that it’s all ready to go on a Slack side.
Time to configure the 4G router
I use Node-Red for this as it’s quick and easy. We can use linux script as well for basics. I have Advantech industrial 4G routers from here https://dureco.com.au/collections/4g-routersInstall Node-Red User Module (https://ep.advantech-bb.cz/products/software/user-modules#node-red) and navigate to IP_OF_ROUTER:1880 you will need to login with the same login and password as a router.
Next import sample Node-Red flow. Find here.The sample flow does look like this:

It is set up to retrieve status information every 60sec and I introduce a logic condition, where I am interested in a status message only if signal strength changes over a certain value. I have selected 4dBm. You can change or use a different metrics based on what you are interested in.
In a Debug Tab will be output from Http Request Node. The successful POST to your Slack channel will look similar to this (notice statusCode: 200, payload: “ok”):
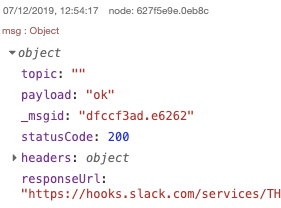
In a case there is an error, it will be indicated in payload property and status code will be different probably 400.
Conclusion
This example can easily be modified for different messaging platform. Same to say about alarming metrics, which can be multitude. The most important is, we can get quite sophisticated alarming, monitoring and debugging which suits individual workflow with little effort.
Article first published at www.viimto.com